7.
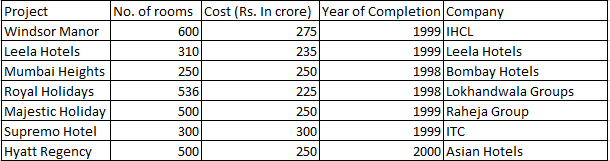
The following table gives the number of rooms in different hotels in Mumbai and the cost of building each one of them. Note that all the projects started in 1997
Note: All projects start in 1997.Which of the following had the least cost per room?
8. Which of the following has the maximum number of rooms per crore of rupees?
9. Assume that the cost of the project is incurred in the year of completion; interest is charged at the rate of 10% per annum. What is the cost incurred for projects completed in 1998?
10. Assume that the cost of the project is incurred in the year of completion; interest is charged at the rate of 10% per annum. What is the cost incurred for projects completed in 1999?
11. What is the approximate cost incurred for projects completed by 2000? (in crores)
12.
The graph given below shows the quantity of milk and food grains consumed annually along with female and male population (in millions). Use the data to answer the questions that follow.
When was the per capita production of milk least?
13. When was the per capita production of foodgrains most?
14. In which year was the difference between the percentage increase in the production of food grains and milk maximum?
15. If milk contains 320 calories and foodgrains contain 160 calories, in which year was the per capita consumption of calories highest?
16. If one gallon milk contains 120 g of a particular nutrient and one tonne of foodgrains contains 80 g of the same nutrient, in which year was the availability of this nutrient maximum?
17. Referring to the previous question, in which year was the per capita consumption of this nutrient highest?
18.
The graph given below gives the yearly details of money invested in producing a certain product over the years 1991 to 1995. It also gives the profit (in ‘000 rupees).
In which year was the increase in raw material maximum?
19. In which period was the decrease in profit maximum (as a percentage)?
20. Which component of the cost production has remained more or less constant over the period?
21. In which year were the overheads, as a percentage of the raw material, maximum?
22. What percentage of the costs did the profits form over the period?
23. If the interest component is not included in the total cost calculation, which year would show the maximum profit per unit cost?
24.
The following table gives the tariff [in paise per kilo-watt-hour (kWh)] levied by the UPSEB in 1994-95, in four sectors and the regions within them. The table also gives the percentage change in the tariff as compared to 1991-92.
If the amount of power consumed by the various regions in sector 1 is the same, then as compared to 1991-92 the net tariff in 1994-95
25. What was the approximate average tariff in sector 3 in 1991-92?
Terms And Service:We do not guarantee the accuracy of available data ..We Provide Information On Public Data.. Please consult an expert before using this data for commercial or personal use
 Note: All projects start in 1997.Which of the following had the least cost per room?
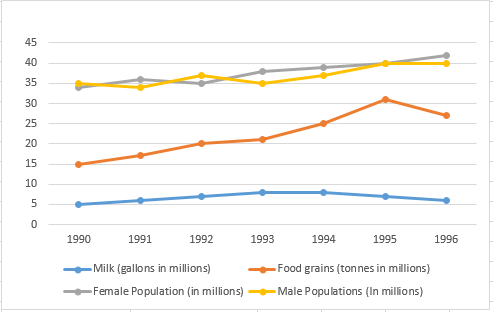 When was the per capita production of milk least?
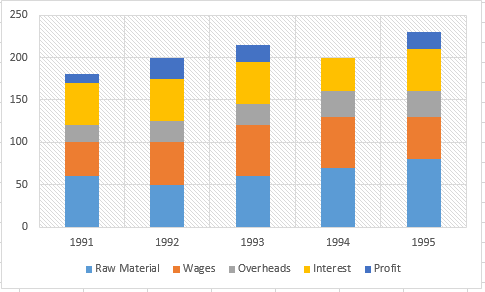 In which year was the increase in raw material maximum?
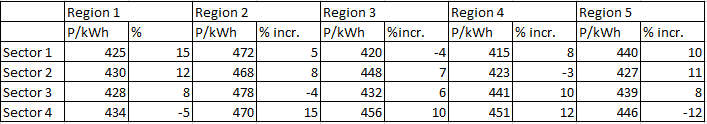 If the amount of power consumed by the various regions in sector 1 is the same, then as compared to 1991-92 the net tariff in 1994-95
 Powered By:Omega Web Solutions